


.svg)
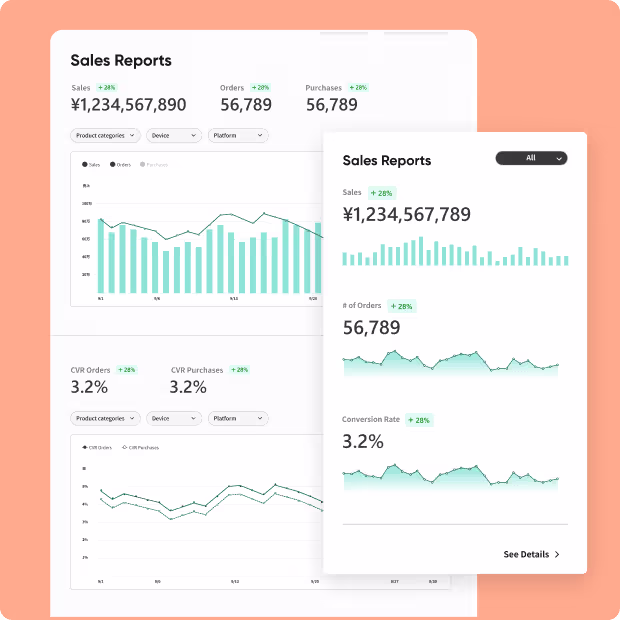
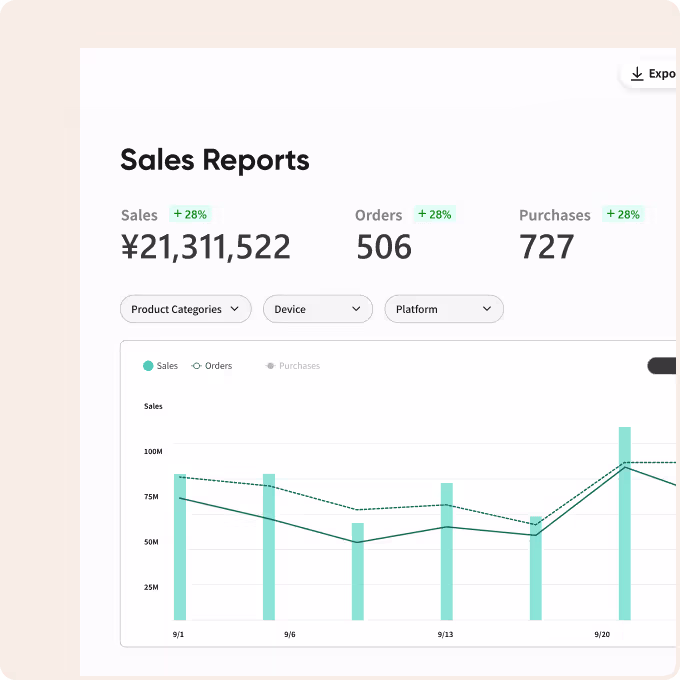
Go Sale Report where you can see how main KPIs such as Sales, Conversions rate went. You can download visualized sales chart as PDF. No need to create a colorful chart anymore.

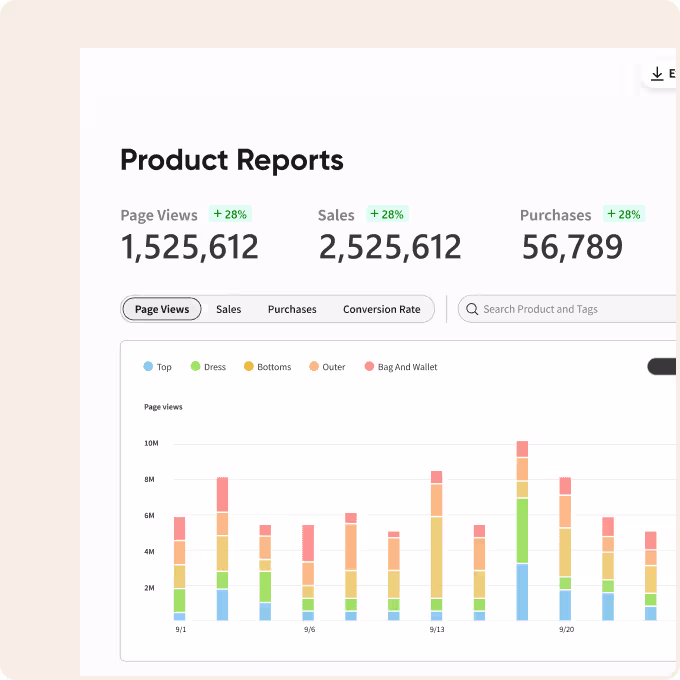
Go to Product Report where you can see not only category level Conversion rate but also Average Order Values, purchased size. The category can drill down to child category level and even product level.

Rankings tells you what product, brand or category drove store's performance with intuitive visualization. Share those well performed products with Marketing team so team can maximize the potential sales.

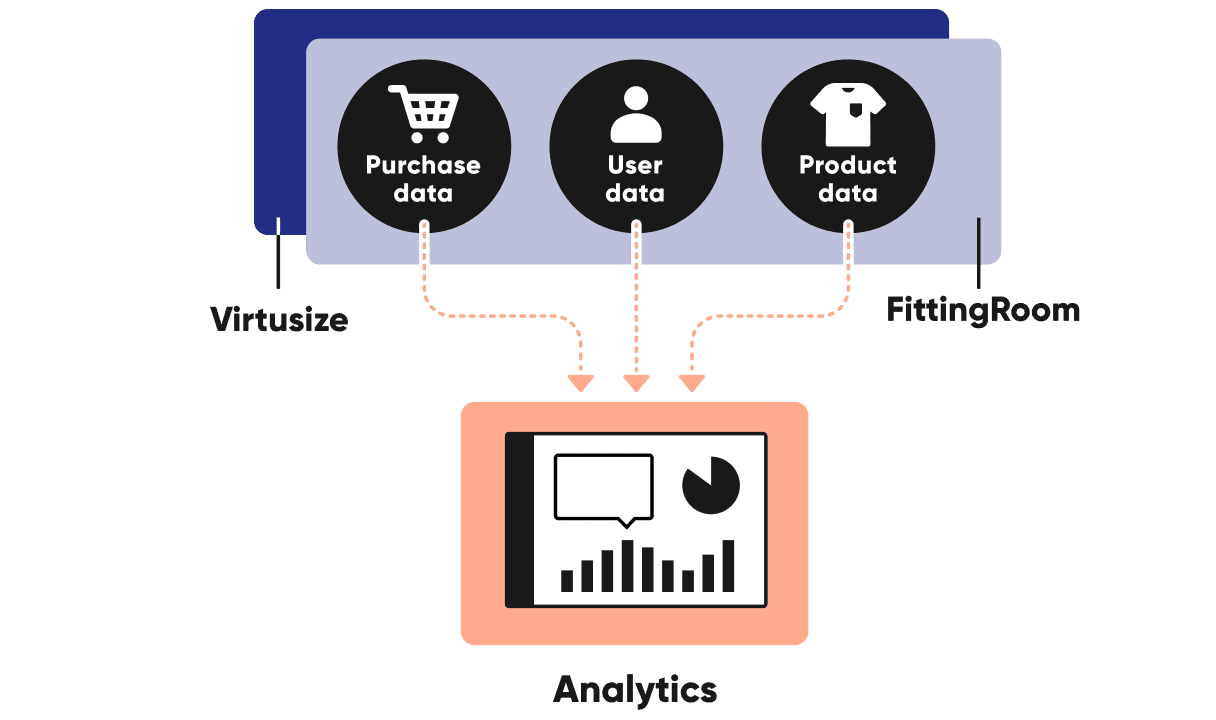
You can simply share return item list with Virtusize team. Our data science team will upload the data to Analytics. No extra time consuming process is needed.
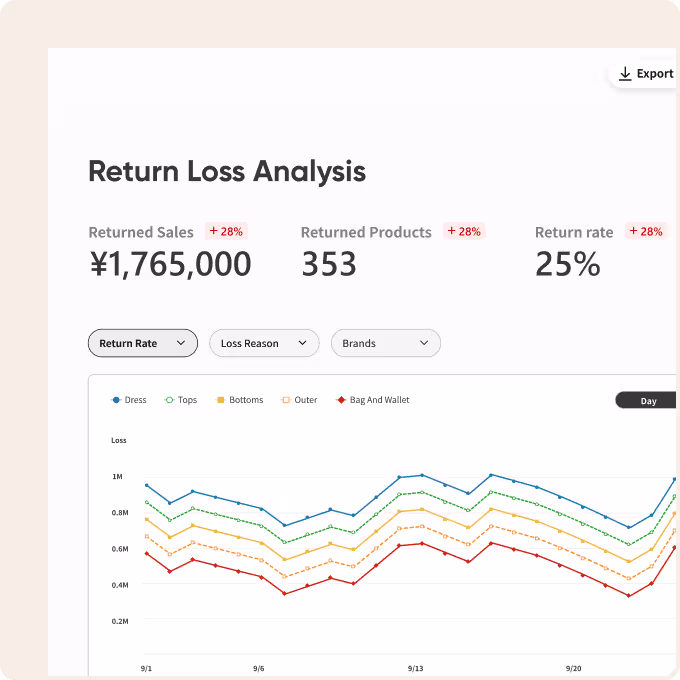
Visualized return rate chart tells you how the performance is going. You can easily identify the problematic category which damages your store's performance. Find root cause and discuss how to improve.
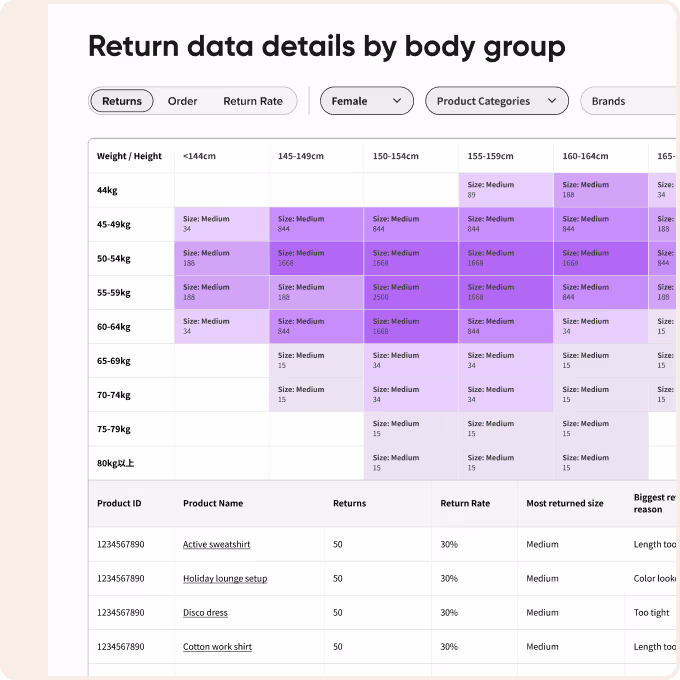
Return data can be also utilized for product manufacturings. By connecting our unique body data to returned data, you can see where the size mismatches happen the most by looking at body group x order heats-map.
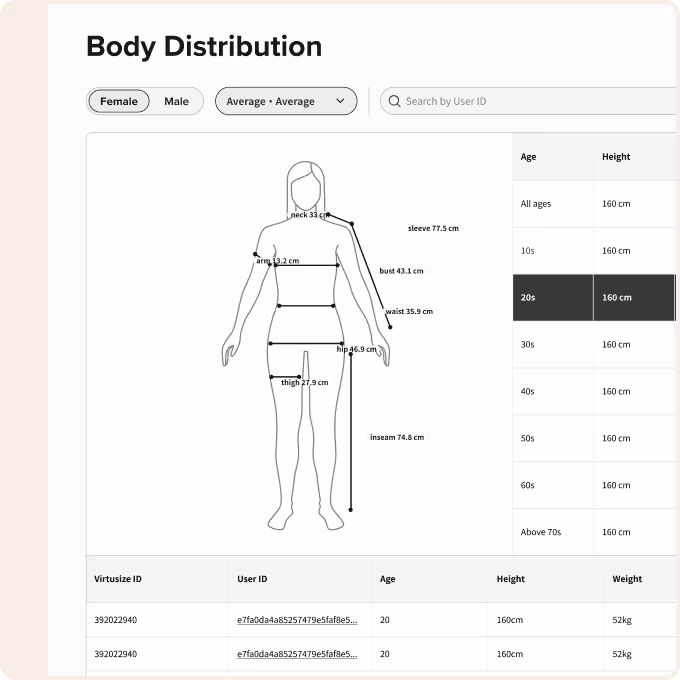
Customer report provides you with overview of your customer's body data with virtual silhouette , not only height and weight but also neck, hip, waist size are shown. You can compare region to region in order to discuss the best localization strategy of manufacturing.
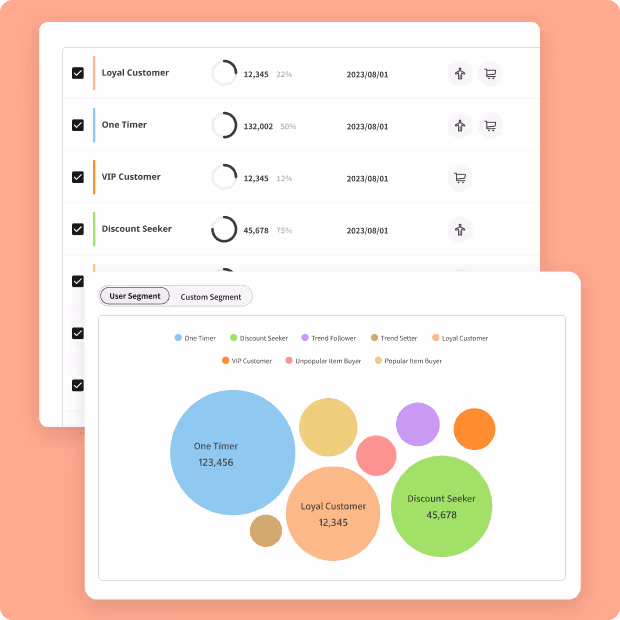
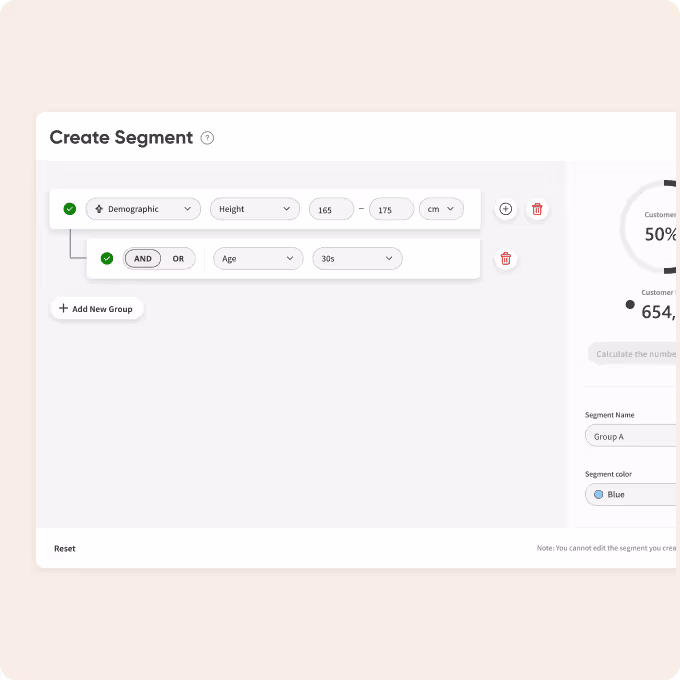
By using body data, you can create a customer segment by your own. Set body data you want to track and create a unique segment group. Track what type of products, brands those users are buying in your store.
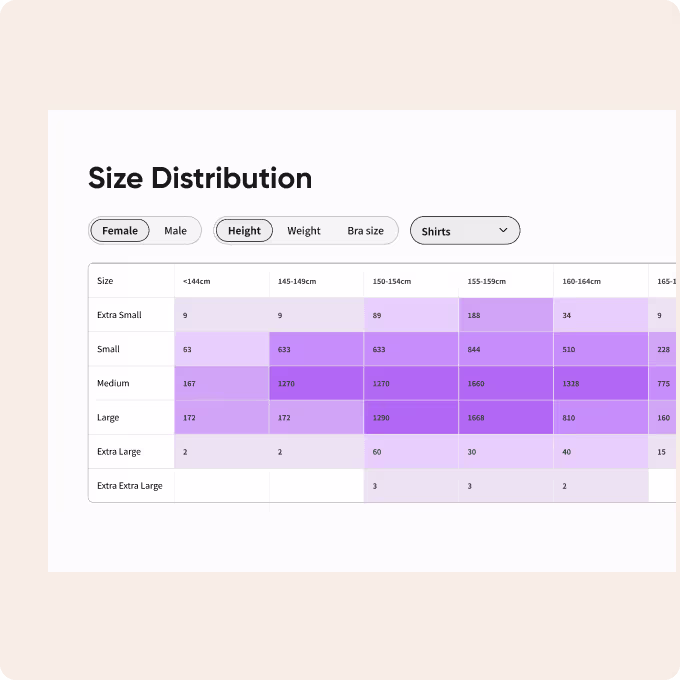
Connecting Virtusize body data with Order data gives you the insight that which products are more popular among specific body type - short, tall etc. You can finally capture what products, sizes your users are looking for based on body data.


.svg)