
A size chart for an online store should show two things: the body measurements each size is designed for, and the actual measurements of each garment, with a diagram, both units and a short fit note, placed right next to the size selector. Get those right and the chart stops being a box to tick and starts preventing returns.
In Why Size Charts Alone Don't Solve Fit, we explained why a size chart on its own can't eliminate sizing guesswork. But every fashion store still needs one, and a well-built chart makes a real difference to the shoppers who use it. Here's how to build one in seven steps.
Step 1: Use both body and garment measurements
Most size charts on fashion sites are body charts: they tell the shopper what chest or waist measurement each size is designed for. These are useful, but they hide the most important information, which is how big the garment actually is.
Garment measurements describe the item itself, laid flat: chest width, length, sleeve length, rise, inseam. They let shoppers compare a product with something already in their wardrobe, which is far easier than measuring their own body.
The best charts show both: a body chart for the size range, and garment measurements for each individual product.
Step 2: Make it product-specific
A single chart copied across every product page is the most common size-chart mistake. A slim-fit shirt and an oversized shirt in the same size have very different measurements. If your chart says they are the same, shoppers will trust it once and never again.
Pull measurements from each product's tech pack and publish them on that product's page.
Step 3: Measure consistently, and say how
Shoppers need to know what each number means. Is "chest" measured flat across or all the way around? Is "length" from the shoulder seam or the back of the collar?
- Use the same measuring points for every product in a category.
- Add a simple diagram showing where each measurement is taken.
- State whether measurements are flat or circumference.
- Give a tolerance if production varies ("±1 cm").
Step 4: Show both units and the right size systems
Show centimetres and inches with a toggle. If you sell internationally, add the size systems your customers know: US, UK, EU, Japan, Korea. Japanese and Korean sizing in particular run differently from Western labels, so a Japanese M is not a US M.
Step 5: Add fit notes in plain language
Numbers tell part of the story. A short fit note tells the rest:
- "Relaxed fit. Size down for a closer fit."
- "Runs small in the shoulders. Size up if between sizes."
- "Model is 178 cm and wears M."
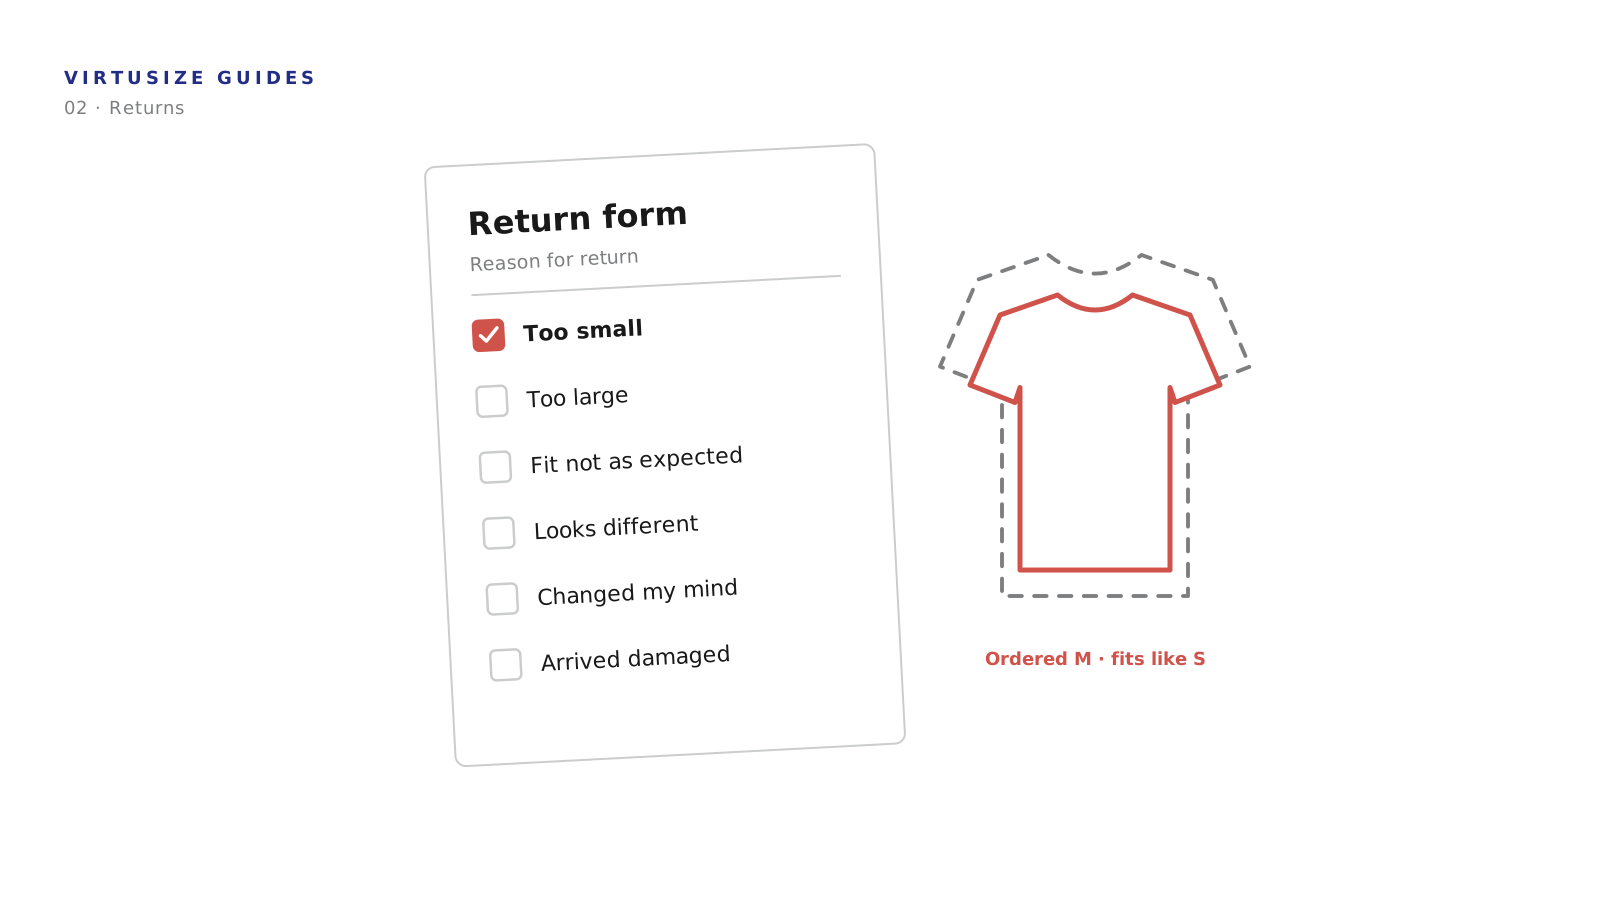
Use your return-reason data to write these. If a style keeps coming back as "too tight," say so on the page.
Step 6: Put it where shoppers look
A size chart hidden in a footer link or a separate page goes unused. Put a clear "Size guide" link right next to the size selector, and open it in a panel so the shopper stays on the product page.
Step 7: Make it readable on a phone
A large share of fashion browsing happens on mobile, and wide tables with eight columns are unreadable on a small screen. Show the shopper's likely size first, let them scroll horizontally, and keep the header row fixed.
What are the most common mistakes on a size chart for an online store?
The mistakes that cause the most returns are using one chart for every product and showing body measurements only.
- One chart for every product. It doesn't reflect real differences in cut. Fix: publish product-specific garment measurements.
- Body measurements only. Shoppers can't compare with clothes they already own. Fix: add garment measurements.
- No measuring diagram. Numbers get misread. Fix: add a simple diagram.
- Only one size system. International shoppers convert wrongly. Fix: show the local systems your customers use.
- A hidden link. Shoppers guess instead of checking. Fix: place the link beside the size selector.
Can a size chart alone stop size-related returns?
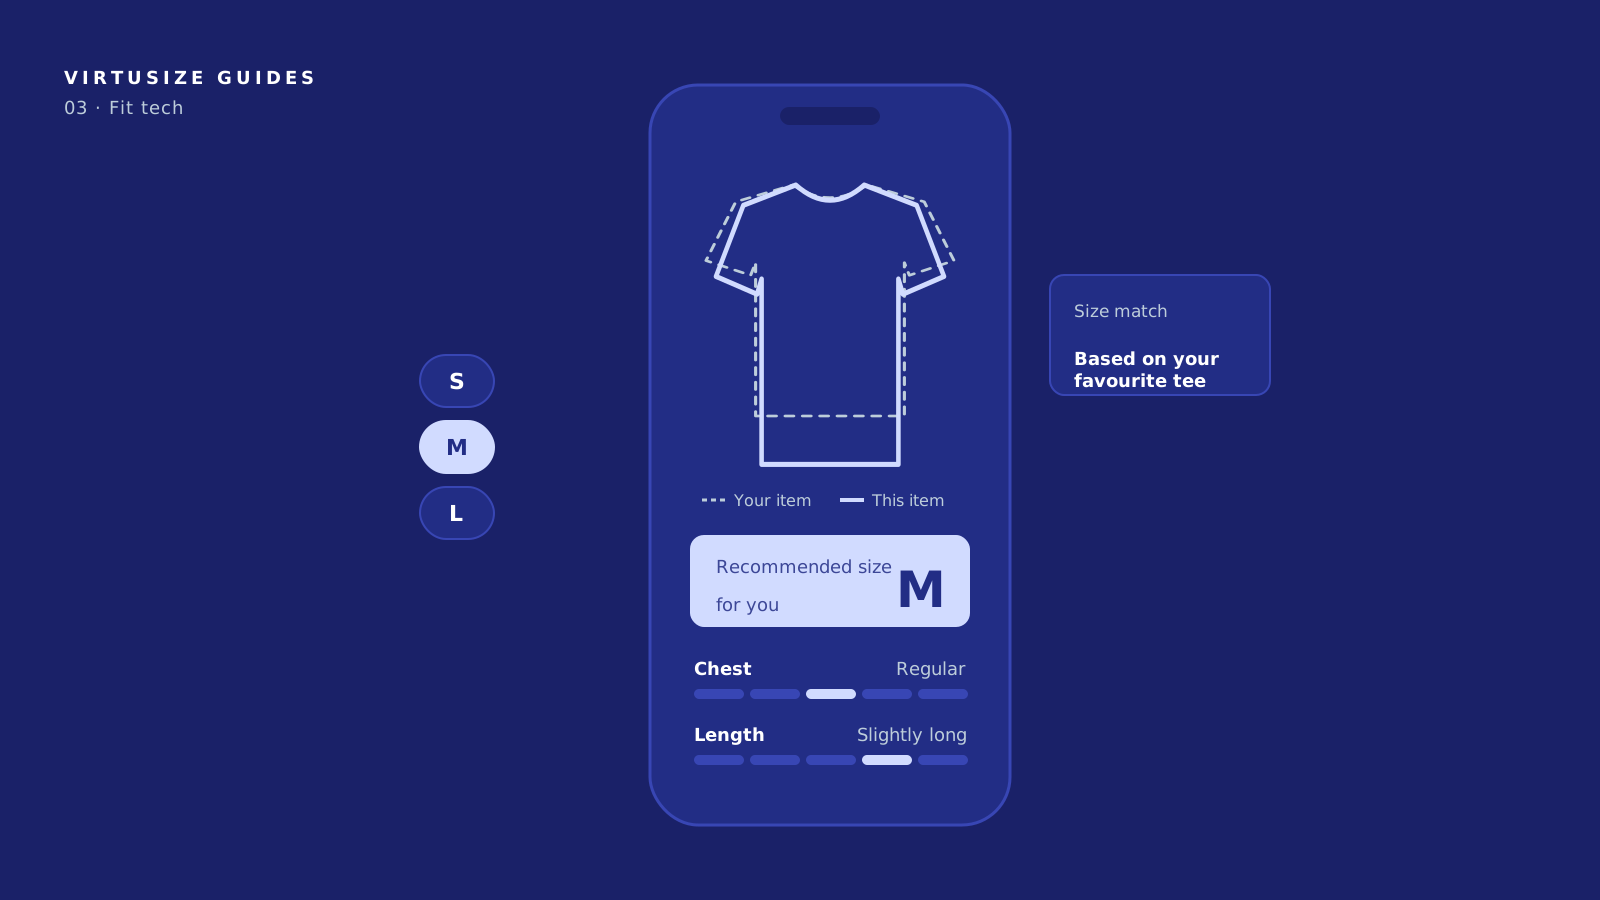
No. Even a perfect chart asks the shopper to do work: find a tape measure or a garment, take measurements and compare numbers. Many shoppers won't. That's why the best-performing product pages pair a strong size chart with a size recommendation tool that does the comparison for them.
Virtusize uses the same garment measurements you've gathered for your chart, so the work you put into better data also powers personalised size recommendations and visual fit comparisons.
See how Virtusize turns your size data into confident purchases. Book a demo
Frequently asked questions
What should a size chart include?
Body measurements for each size, garment measurements for each product, a diagram of where measurements are taken, both centimetres and inches, relevant international size systems and a short fit note.
What is the difference between body and garment measurements?
Body measurements describe the person a size is designed for. Garment measurements describe the item itself, laid flat. Garment measurements let shoppers compare with clothes they already own.
Do size charts reduce returns?
Accurate, product-specific charts help, but only for shoppers who use them. Pairing a chart with a size recommendation tool reaches the many shoppers who won't measure themselves.
Where should a size chart go on a product page?
Directly next to the size selector, opening in a panel so the shopper doesn't leave the page.
A size chart for an online store should show two things: the body measurements each size is designed for, and the actual measurements of each garment, with a diagram, both units and a short fit note, placed right next to the size selector. Get those right and the chart stops being a box to tick and starts preventing returns.
In Why Size Charts Alone Don't Solve Fit, we explained why a size chart on its own can't eliminate sizing guesswork. But every fashion store still needs one, and a well-built chart makes a real difference to the shoppers who use it. Here's how to build one in seven steps.
Step 1: Use both body and garment measurements
Most size charts on fashion sites are body charts: they tell the shopper what chest or waist measurement each size is designed for. These are useful, but they hide the most important information, which is how big the garment actually is.
Garment measurements describe the item itself, laid flat: chest width, length, sleeve length, rise, inseam. They let shoppers compare a product with something already in their wardrobe, which is far easier than measuring their own body.
The best charts show both: a body chart for the size range, and garment measurements for each individual product.
Step 2: Make it product-specific
A single chart copied across every product page is the most common size-chart mistake. A slim-fit shirt and an oversized shirt in the same size have very different measurements. If your chart says they are the same, shoppers will trust it once and never again.
Pull measurements from each product's tech pack and publish them on that product's page.
Step 3: Measure consistently, and say how
Shoppers need to know what each number means. Is "chest" measured flat across or all the way around? Is "length" from the shoulder seam or the back of the collar?
- Use the same measuring points for every product in a category.
- Add a simple diagram showing where each measurement is taken.
- State whether measurements are flat or circumference.
- Give a tolerance if production varies ("±1 cm").
Step 4: Show both units and the right size systems
Show centimetres and inches with a toggle. If you sell internationally, add the size systems your customers know: US, UK, EU, Japan, Korea. Japanese and Korean sizing in particular run differently from Western labels, so a Japanese M is not a US M.
Step 5: Add fit notes in plain language
Numbers tell part of the story. A short fit note tells the rest:
- "Relaxed fit. Size down for a closer fit."
- "Runs small in the shoulders. Size up if between sizes."
- "Model is 178 cm and wears M."
Use your return-reason data to write these. If a style keeps coming back as "too tight," say so on the page.
Step 6: Put it where shoppers look
A size chart hidden in a footer link or a separate page goes unused. Put a clear "Size guide" link right next to the size selector, and open it in a panel so the shopper stays on the product page.
Step 7: Make it readable on a phone
A large share of fashion browsing happens on mobile, and wide tables with eight columns are unreadable on a small screen. Show the shopper's likely size first, let them scroll horizontally, and keep the header row fixed.
What are the most common mistakes on a size chart for an online store?
The mistakes that cause the most returns are using one chart for every product and showing body measurements only.
- One chart for every product. It doesn't reflect real differences in cut. Fix: publish product-specific garment measurements.
- Body measurements only. Shoppers can't compare with clothes they already own. Fix: add garment measurements.
- No measuring diagram. Numbers get misread. Fix: add a simple diagram.
- Only one size system. International shoppers convert wrongly. Fix: show the local systems your customers use.
- A hidden link. Shoppers guess instead of checking. Fix: place the link beside the size selector.
Can a size chart alone stop size-related returns?
No. Even a perfect chart asks the shopper to do work: find a tape measure or a garment, take measurements and compare numbers. Many shoppers won't. That's why the best-performing product pages pair a strong size chart with a size recommendation tool that does the comparison for them.
Virtusize uses the same garment measurements you've gathered for your chart, so the work you put into better data also powers personalised size recommendations and visual fit comparisons.
See how Virtusize turns your size data into confident purchases. Book a demo
Frequently asked questions
What should a size chart include?
Body measurements for each size, garment measurements for each product, a diagram of where measurements are taken, both centimetres and inches, relevant international size systems and a short fit note.
What is the difference between body and garment measurements?
Body measurements describe the person a size is designed for. Garment measurements describe the item itself, laid flat. Garment measurements let shoppers compare with clothes they already own.
Do size charts reduce returns?
Accurate, product-specific charts help, but only for shoppers who use them. Pairing a chart with a size recommendation tool reaches the many shoppers who won't measure themselves.
Where should a size chart go on a product page?
Directly next to the size selector, opening in a panel so the shopper doesn't leave the page.
A size chart for an online store should show two things: the body measurements each size is designed for, and the actual measurements of each garment, with a diagram, both units and a short fit note, placed right next to the size selector. Get those right and the chart stops being a box to tick and starts preventing returns.
In Why Size Charts Alone Don't Solve Fit, we explained why a size chart on its own can't eliminate sizing guesswork. But every fashion store still needs one, and a well-built chart makes a real difference to the shoppers who use it. Here's how to build one in seven steps.
Step 1: Use both body and garment measurements
Most size charts on fashion sites are body charts: they tell the shopper what chest or waist measurement each size is designed for. These are useful, but they hide the most important information, which is how big the garment actually is.
Garment measurements describe the item itself, laid flat: chest width, length, sleeve length, rise, inseam. They let shoppers compare a product with something already in their wardrobe, which is far easier than measuring their own body.
The best charts show both: a body chart for the size range, and garment measurements for each individual product.
Step 2: Make it product-specific
A single chart copied across every product page is the most common size-chart mistake. A slim-fit shirt and an oversized shirt in the same size have very different measurements. If your chart says they are the same, shoppers will trust it once and never again.
Pull measurements from each product's tech pack and publish them on that product's page.
Step 3: Measure consistently, and say how
Shoppers need to know what each number means. Is "chest" measured flat across or all the way around? Is "length" from the shoulder seam or the back of the collar?
- Use the same measuring points for every product in a category.
- Add a simple diagram showing where each measurement is taken.
- State whether measurements are flat or circumference.
- Give a tolerance if production varies ("±1 cm").
Step 4: Show both units and the right size systems
Show centimetres and inches with a toggle. If you sell internationally, add the size systems your customers know: US, UK, EU, Japan, Korea. Japanese and Korean sizing in particular run differently from Western labels, so a Japanese M is not a US M.
Step 5: Add fit notes in plain language
Numbers tell part of the story. A short fit note tells the rest:
- "Relaxed fit. Size down for a closer fit."
- "Runs small in the shoulders. Size up if between sizes."
- "Model is 178 cm and wears M."
Use your return-reason data to write these. If a style keeps coming back as "too tight," say so on the page.
Step 6: Put it where shoppers look
A size chart hidden in a footer link or a separate page goes unused. Put a clear "Size guide" link right next to the size selector, and open it in a panel so the shopper stays on the product page.
Step 7: Make it readable on a phone
A large share of fashion browsing happens on mobile, and wide tables with eight columns are unreadable on a small screen. Show the shopper's likely size first, let them scroll horizontally, and keep the header row fixed.
What are the most common mistakes on a size chart for an online store?
The mistakes that cause the most returns are using one chart for every product and showing body measurements only.
- One chart for every product. It doesn't reflect real differences in cut. Fix: publish product-specific garment measurements.
- Body measurements only. Shoppers can't compare with clothes they already own. Fix: add garment measurements.
- No measuring diagram. Numbers get misread. Fix: add a simple diagram.
- Only one size system. International shoppers convert wrongly. Fix: show the local systems your customers use.
- A hidden link. Shoppers guess instead of checking. Fix: place the link beside the size selector.
Can a size chart alone stop size-related returns?
No. Even a perfect chart asks the shopper to do work: find a tape measure or a garment, take measurements and compare numbers. Many shoppers won't. That's why the best-performing product pages pair a strong size chart with a size recommendation tool that does the comparison for them.
Virtusize uses the same garment measurements you've gathered for your chart, so the work you put into better data also powers personalised size recommendations and visual fit comparisons.
See how Virtusize turns your size data into confident purchases. Book a demo
Frequently asked questions
What should a size chart include?
Body measurements for each size, garment measurements for each product, a diagram of where measurements are taken, both centimetres and inches, relevant international size systems and a short fit note.
What is the difference between body and garment measurements?
Body measurements describe the person a size is designed for. Garment measurements describe the item itself, laid flat. Garment measurements let shoppers compare with clothes they already own.
Do size charts reduce returns?
Accurate, product-specific charts help, but only for shoppers who use them. Pairing a chart with a size recommendation tool reaches the many shoppers who won't measure themselves.
Where should a size chart go on a product page?
Directly next to the size selector, opening in a panel so the shopper doesn't leave the page.